Population Change


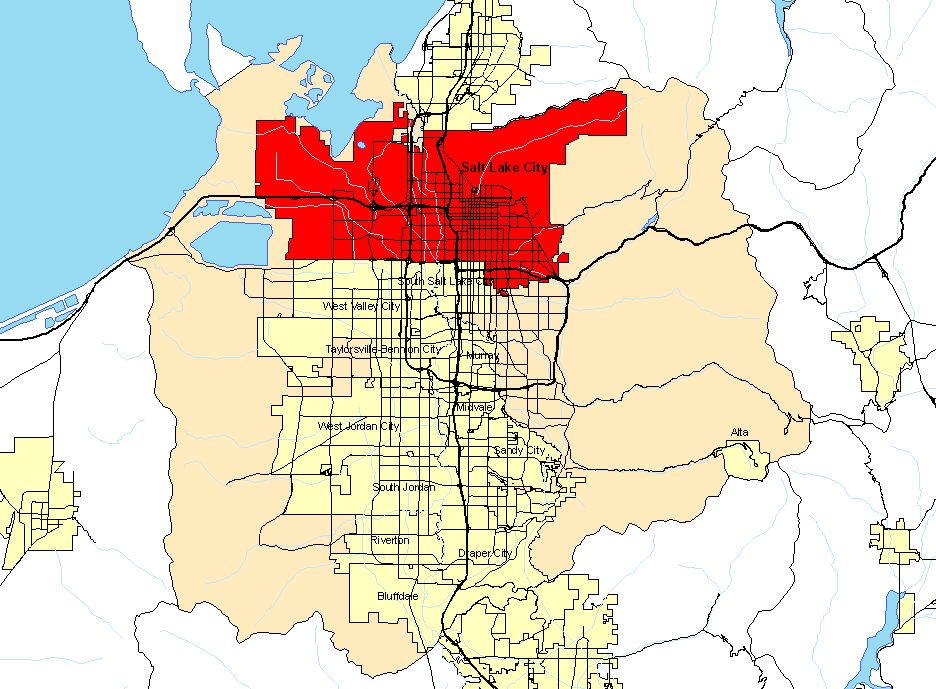
Red area showing the boundaries of Salt Lake City.  I did this assignment looking down on Salt Lake City. 


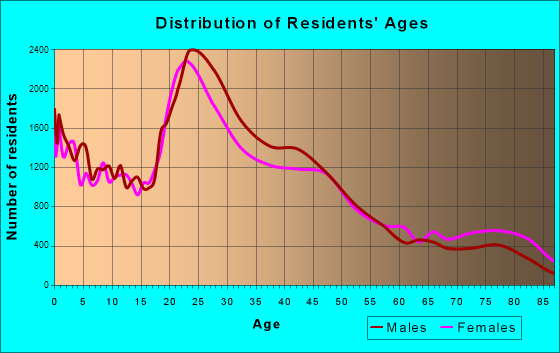
Chart showing the ages of Salt Lake City residents.  (Source: http://www.city-data.com)


It took me a few minutes to figure out the U.S. Census website.  But once I sorted out how to quickly look up information, I found it to actually be quite enlightening!  Since I had taken a walk and made observations around the state capitol building, I looked up the population statistics for Salt Lake City. According to the 2010 census, there are 186,440 people living in Salt Lake City.  At the time of this census, it was projected that in 2012, the Salt Lake City population would be 189, 314.  

As far as various ethnicities, there are a fair amount of different ethnic residents.  As most of us know, however, caucasian is still by far the majority.  


Below are the exact number for Salt Lake City residents in terms of race percentages.  

White alone, percent definition and source infoWhite alone, percent, 2010 (a)75.1%

Black or African American alone, percent definition and source infoBlack or African American alone, percent, 2010 (a)2.7%

American Indian and Alaska Native alone, percent definition and source infoAmerican Indian and Alaska Native alone, percent, 2010 (a)1.2%

Asian alone, percent definition and source infoAsian alone, percent, 2010 (a)4.4%

Native Hawaiian and Other Pacific Islander alone, percent definition and source infoNative Hawaiian and Other Pacific Islander alone, percent, 2010 (a)2.0%

Two or More Races, percent definition and source infoTwo or More Races, percent, 20103.7%

Hispanic or Latino, percent definition and source infoHispanic or Latino, percent, 2010 (b)22.3%

White alone, not Hispanic or Latino, percent definition and source infoWhite alone, not Hispanic or Latino, percent, 201065.6%


According to the 1950 census, Salt Lake City was number 52 in the country in terms of largest urban area.  I was completely blown away when I saw that the census counted around the same number of people in 1950 as it did in 2010.  The census counted Salt Lake City as having 182,121 residents in 1950.  As we recall, the 2010 census showed Salt Lake City as having 186,440.  I suspect that the reason for this is simply because although the Wasatch Front has continued to develop, the city boundary of Salt Lake City hasn't really changed much.  However, the 2010 census predicts that in 2012 there will be 189, 314 residents.  That is nearly 3k more residents in just two years.  But let's recall that the growth of residents from 1950 to 2010 is only around 4k.  These numbers seem strange to me.  

The land area of Salt Lake City as far as the 1950 census shows is 53.9 miles.  The density is 3,379 per square mile.  Within these boundaries, there can only be so many people.  Furthermore, just a quick drive around Salt Lake City will show you that there hasn't been exactly a lot of new high-rise development, either.  There has been some, yes, but not like a lot of other heavily populated urban areas I have spent time in.  

BIRTHS AND DEATHS

While researching births and deaths for Utah, I wasn't surprised to see that Utah has one of the highest birth rates in the nation.  My novice guess for this reason is simply due to two reasons:  first of all, predominant religion being the mormon faith.  It is my understanding that the mormon faith encourages its members to have large families if possible and make them the cornerstone of life.  Second of all, I would attribute high birth rates to be due to all of the new "up-and-coming" residential areas that are reasonably priced.  These residential areas are full of young families who contribute to the birth rates.  According to babycenter.com, Utah has the highest birth rate.  In Utah, there are 88 births per 1,000 women ages 15 to 44.  (babycenter.com received their facts from cdc.gov)  

                    Utah Births                Utah Deaths
1950                 21,192                  4,974
2010              52,164                14,647 
http://www.health.utah.gov/vitalrecords/2012bx_Final_122013.pdf
 
Above we can compare and contrast the difference between Utah births and deaths for the years 1950 and 2010.  As assumed, the rates have gone up dramatically.  However, the percentages of deaths in relationship to births is decreased on 2010.  We could obviously attribute that to better health care advancements, urbanization and the natural progression of communities.   


Reflection


Upon first looking through the objectives of this assignment, I assumed I could easily obtain the data and information I'd like with a few clicks of the mouse.  However, I quickly learned that although we have many resources at our fingertips, sometimes its difficult to obtain the exact information and data you'd like.  I assumed I could easily locate the numbers desired for Salt Lake City.  But the only thing I was able to obtain were numbers for the entire states of Utah.  Although this may sound like a negative observation, I feel that it is indeed, positive.  It is good to get a taste of what goes into compiling data and charts/graphs.  

The other major thing I feel like I learned from this assignment was that the population of downtown Salt Lake City between 1950 and 2012 really hasn't changed very much.  Before researching these numbers, I assumed that the population numbers would be significant.  But upon further thought, it only makes sense that the numbers would remain similar.  It is only common sense that the borders of the city have remained constant over the past 62 years.  Obviously, other areas around Salt Lake City itself have developed and increased in population.  But the main city itself will remain fairly similar and grow in population rather slowly.    


Make a Free Website with Yola.